Bridging Data and Practice: How the New MAP Growth State Standards View is Transforming Classroom Instruction
By Educational Technology & Pedagogy News Desk
Published: September 2026
Main Facts
For decades, modern educators have operated under a paradox: they are swimming in data, yet starving for actionable insights. Following every testing window, teachers, instructional coaches, and building administrators spend countless hours reviewing spreadsheets, analyzing bar charts, and breaking down score trends. Yet, a persistent question inevitably echoes through staff rooms across the country: What happens now?
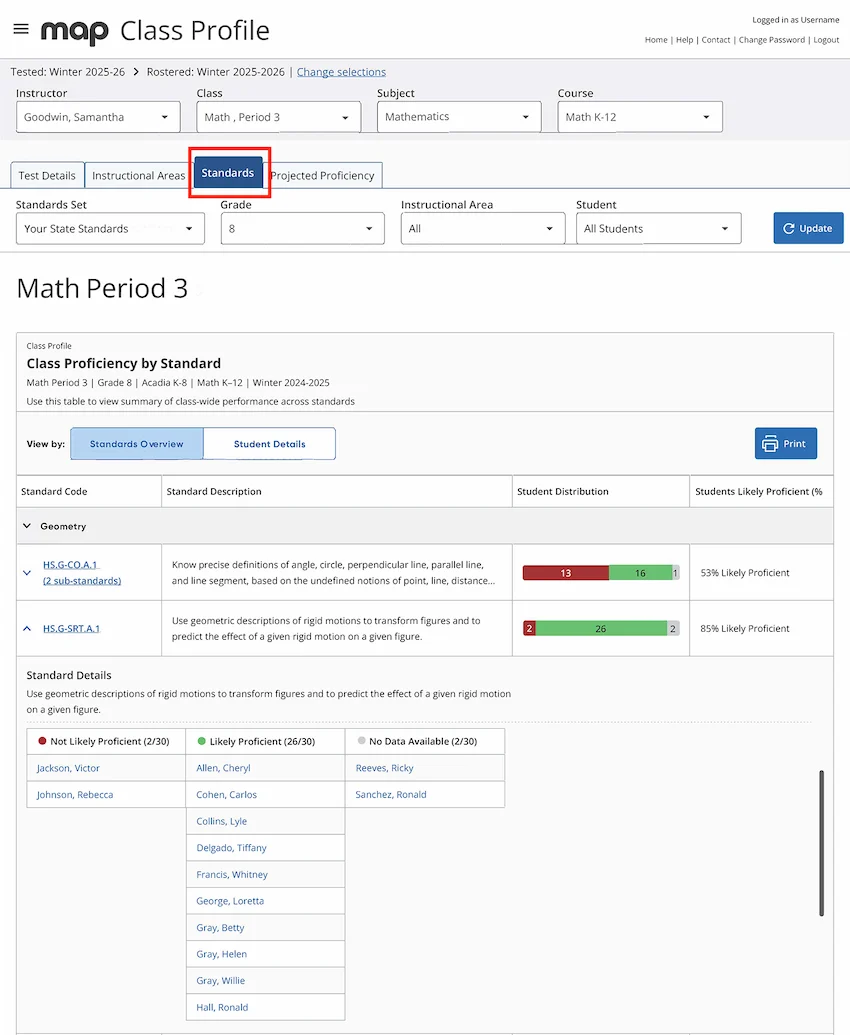
To solve this systemic educational challenge, NWEA has introduced a transformative update to its widely utilized MAP® Growth™ assessment suite. The newly launched state standards view within the Class Profile report—powered by Pulse, NWEA’s advanced learning sciences intelligence platform—aims to close the gap between raw data and daily lesson planning.
Instead of forcing educators to reverse-engineer abstract psychometric metrics (such as RIT scores) to figure out what a student actually knows, the new feature lets teachers start directly with the specific academic standards they are already preparing to teach. By combining standards-level proficiency data with granular instructional insights, the update shifts the pedagogical paradigm from "What does the data say?" to "What should I do next?"

Chronology: The Evolution of Assessment Data
To understand why this update represents a significant leap forward in educational technology, it is helpful to trace the evolution of classroom data usage over recent years:
- The Era of Quantitative Overload (Late 2000s–2010s): Schools widely adopted computer-adaptive testing like MAP Growth to track student achievement and growth over time. While these tests provided objective measurements of academic standing, the resulting reports were primarily macro-level. Teachers received percentile ranks and RIT scores, but translating those figures into daily lesson modifications required significant time and specialized training.
- The Rise of Professional Learning Communities (PLCs) (2015–2020): Educators increasingly organized into collaborative teams to analyze data windows. However, because assessment reports were decoupled from everyday curricular standards, data analysis frequently felt like an administrative hurdle rather than an instructional springboard. Teachers routinely voiced frustration over balancing data review with the realities of tight planning periods and diverse classrooms.
- The Shift Toward Actionable Intelligence (2021–2025): As educational software evolved, tech providers began embedding learning continua and pedagogical resource links directly into reporting dashboards. Schools moved from asking how students performed to looking at growth trajectories. Yet, a gap remained between broad instructional areas and granular, state-specific curriculum standards.
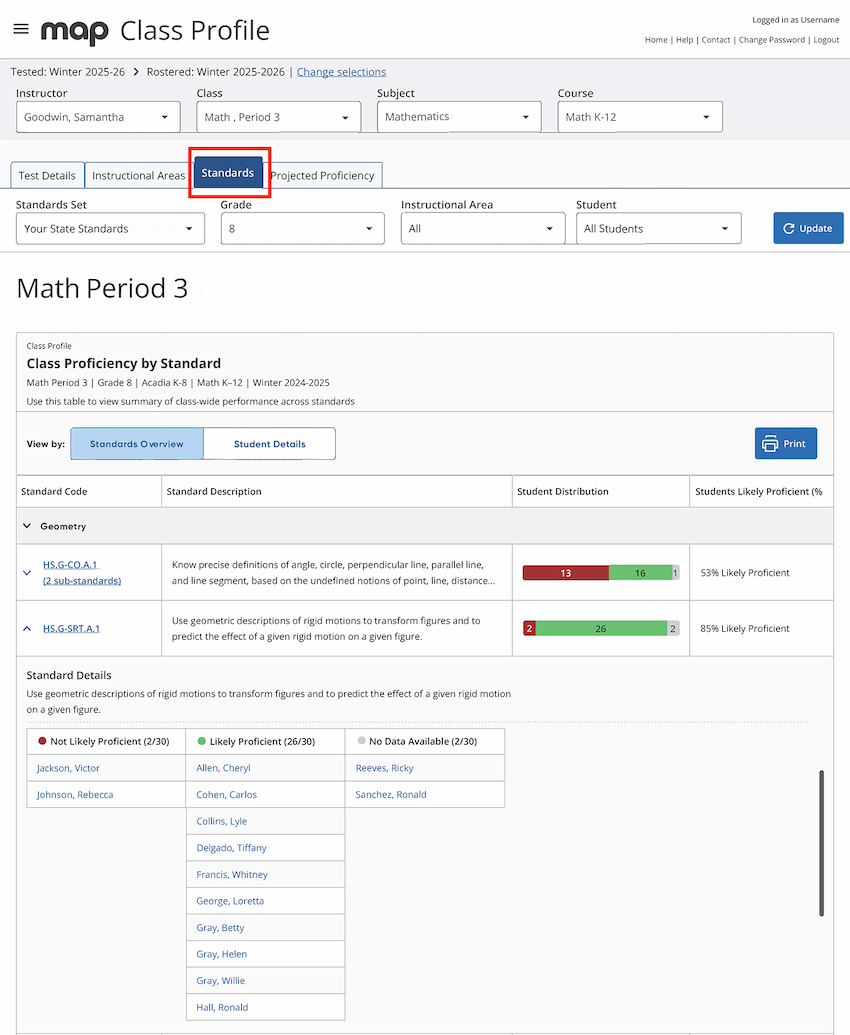
- The Launch of the State Standards View (September 2026): Integrating directly into the existing MAP Growth Class Profile report, NWEA unveiled a dedicated standards tab. This new architecture bridges the gap by mapping student readiness directly against state-specific grade-level standards, eliminating the need for teachers to manually cross-reference external score scales with upcoming curriculum units.
Supporting Data: The Reality of Modern Classrooms
The necessity for streamlined data translation is highlighted by everyday realities in K-12 education:
- Planning Time Constraints: On average, elementary and secondary educators are allocated fewer than five hours per week for independent lesson planning, grading, and data analysis—a window that must accommodate dozens of students with vastly disparate learning needs.
- Heterogeneous Classrooms: In a typical fifth-grade classroom, reading levels can span a five-to-seven-grade bandwidth. A single class profile report might group students together under a broad rubric, masking the reality that while children may share an overall score band, their grasp of specific sub-skills (such as informational text comprehension versus literary analysis) varies widely.
- The Translation Gap: Educational research consistently shows that while over 85% of school districts utilize interim assessment data, fewer than 40% of teachers feel they have immediate, intuitive pathways to use that data to modify instruction mid-unit without extensive extra preparation.
The state standards view addresses these friction points by consolidating instructional areas, exact RIT scores, and year-end proficiency projections into a singular, cohesive digital dashboard.
Official Responses and Expert Perspectives
Educational leaders and curriculum developers have praised the integration for its focus on teacher workflows and student-centric differentiation.

"As educators, we rarely find ourselves with a shortage of data," notes an NWEA curriculum specialist and former instructional coach. "What we’ve often struggled with is translating that data into clear instructional decisions. At the end of the day, teachers don’t teach reports; we teach standards. We plan lessons and units so students have countless opportunities to engage with grade-level content."
By anchoring the software interface around the familiar structure of state curricula, developers sought to reduce cognitive load for busy teachers. Rather than adding another standalone report to an already crowded administrative plate, the standards view lives inside the Class Profile report that educators already access routinely.
"When you are juggling multiple responsibilities, facing limited planning time, and working with a classroom full of diverse learners, it is easy for data analysis to feel disconnected from instructional planning," the specialist adds. "That is why standards-level information is such an exciting step forward. The conversation shifts from understanding data to planning instruction—and that is where we all want to spend our time."
Practical Application: A Case Study in a Fifth-Grade Classroom
To visualize how this plays out in real time, consider a fifth-grade educator preparing an upcoming instructional unit focused on informational text.
Under the Common Core or comparable state standards, students will be engaging heavily with Key Ideas and Details (e.g., determining multiple main ideas, explaining how they are supported by key details, and providing text-based evidence).
1. Recognizing the Learning Progression
Years of classroom experience reveal that while many incoming fifth-graders can successfully locate explicit details when they are clearly stated in a text, grade-level expectations demand a higher cognitive leap. Students must synthesize information, evaluate claims, and draw nuanced conclusions.
2. Investigating Student Variance
When the teacher opens the MAP Growth Class Profile report and navigates to the new standards tab, four students—let us call them Glenn, Julia, Bobby, and Audrey—appear to be grouped similarly in terms of initial performance. However, upon checking the "Instructional areas" breakdown within the standards view, the teacher notices a vital nuance: Glenn’s exact RIT score falls within a different sub-range than his peers.
3. Tailoring Scaffolding and Entry Points
Armed with this precise intelligence, the teacher does not need to guess what to teach next; the curriculum path is already set by the upcoming unit. Instead, the teacher uses the integrated Learning Continuum to understand the developmental progression of the standard.
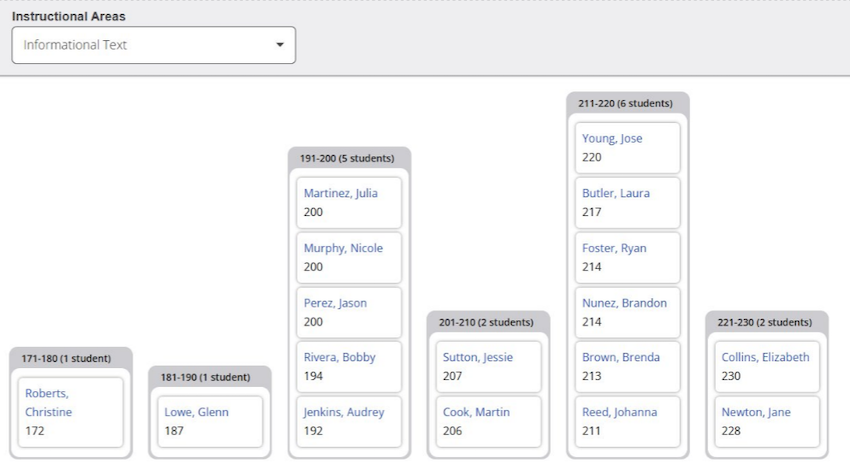
- Glenn may require targeted scaffolding and foundational support in connecting explicit details back to a primary main idea.
- Julia, Bobby, and Audrey, while needing ongoing guidance, may be primed for more complex critical thinking tasks, such as evaluating competing evidence across multiple informational texts.
This realization highlights a foundational truth of modern pedagogy: helping an entire class of diverse learners master the exact same grade-level standard almost always requires multiple, thoughtfully designed entry points.
Implications for Schools, Districts, and Students
The introduction of the state standards view in MAP Growth carries profound implications across multiple tiers of the educational ecosystem:
For Classroom Teachers
- Reduced Planning Friction: By eliminating the manual translation step between psychometric scores and state standards, teachers can plan differentiated centers, small-group interventions, and whole-group lessons in a fraction of the time.
- Targeted Scaffolding: Educators can proactively anticipate where individual students will stumble during an upcoming unit, allowing for preventative intervention rather than reactive remediation.
For Instructional Coaches and Administrators
- Data-Driven Professional Learning: Coaches can use the class profile standards tab during PLCs to guide grade-level teams in examining specific curricular choke points. Conversations shift from broad student deficits to specific pedagogical strategies for teaching rigorous standards.
- Equitable Access to Rigor: Ensuring that every child—regardless of their starting RIT score—has a supported pathway toward year-end grade-level proficiency supports equity initiatives across school districts.
For the Broader EdTech Landscape
- The Rise of Embedded Intelligence: As platforms increasingly leverage learning science layers like Pulse, the industry standard is moving away from static, siloed reporting tools toward dynamic, workflow-integrated intelligence layers.
- Re-centering the Student Experience: Ultimately, the update underscores a vital guiding principle for educational technology: the most valuable data is not the data educators analyze for compliance or archiving, but the data that empowers teachers to take immediate, effective action on behalf of their students.